What the coverage reports—and what it doesn't
Photo-based calorie-tracking applications may underestimate the energy content of meals, according to reports carried by Deccan Herald, Medical Xpress, and Bioengineer.org. That's the verified fact. What's missing is nearly everything else: which apps were tested, how the testing was done, how many meals were analyzed, and by how much the estimates fell short.
No peer-reviewed study link appears in the available coverage. No app names. No methodology. No sample size. No average error margin. The reports describe a limitation without the data needed to measure its scope or severity.
How photo-based calorie tracking is supposed to work
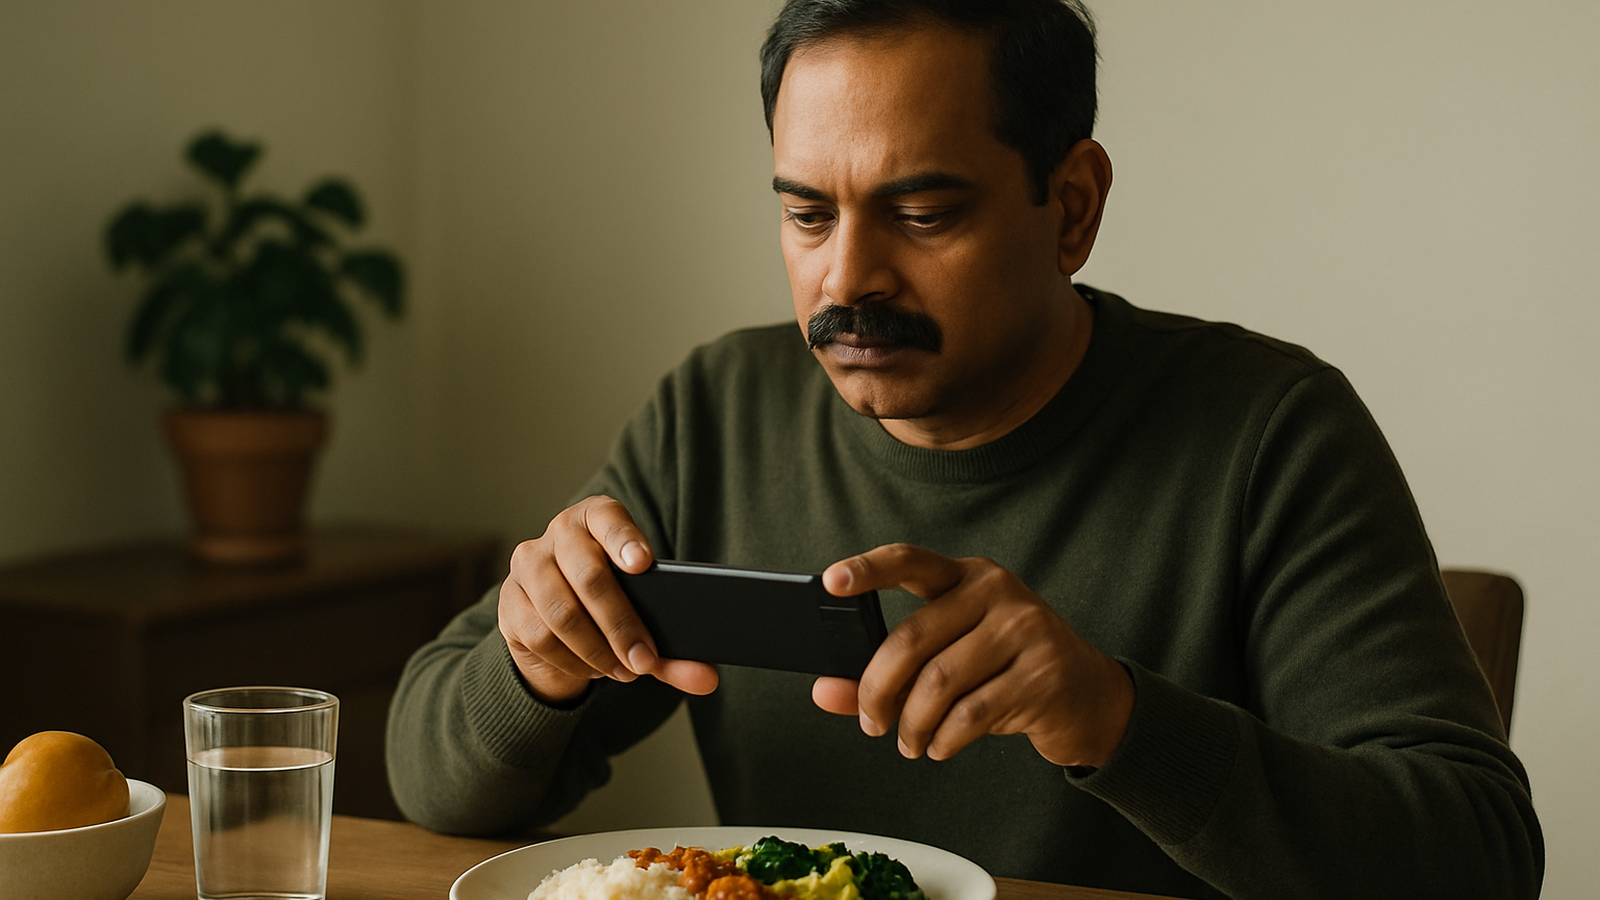
Photo-based trackers ask you to snap a picture of your meal. The app's image-recognition algorithm identifies the foods on your plate—pasta, chicken, broccoli—and estimates portion sizes by comparing visual cues to a database of reference images. It then assigns calorie values based on those identifications and portion guesses.
The technology has inherent blind spots. A camera can't weigh your food. It can't see the butter melted into your vegetables or the oil coating your roasted potatoes. It can't distinguish between full-fat and low-fat cheese, or measure the sugar stirred into your coffee. Cooking methods, hidden ingredients, and energy-dense additions that don't change a dish's appearance all escape the lens. Underestimation is plausible because the algorithm is working from incomplete information.
Why underestimation matters if you're tracking for weight goals
Weight management hinges on energy balance—the relationship between calories consumed and calories burned. If your app logs 400 calories for a meal that actually delivered 550, that 150-calorie gap doesn't disappear. It accumulates. Over a week, a daily undercount of that size adds up to more than 1,000 untracked calories—enough to stall weight loss or create slow, unexplained weight gain.
Systematic undercounting also distorts feedback. You follow your app's budget, hit your daily target, and wonder why the scale isn't cooperating. Many users blame themselves—willpower, metabolism, hidden snacking—when the tool itself may be feeding them incorrect data. The math looks right on screen, but the biology isn't cooperating, and the mismatch breeds frustration and confusion.
What to check if you're already using a photo-based tracker
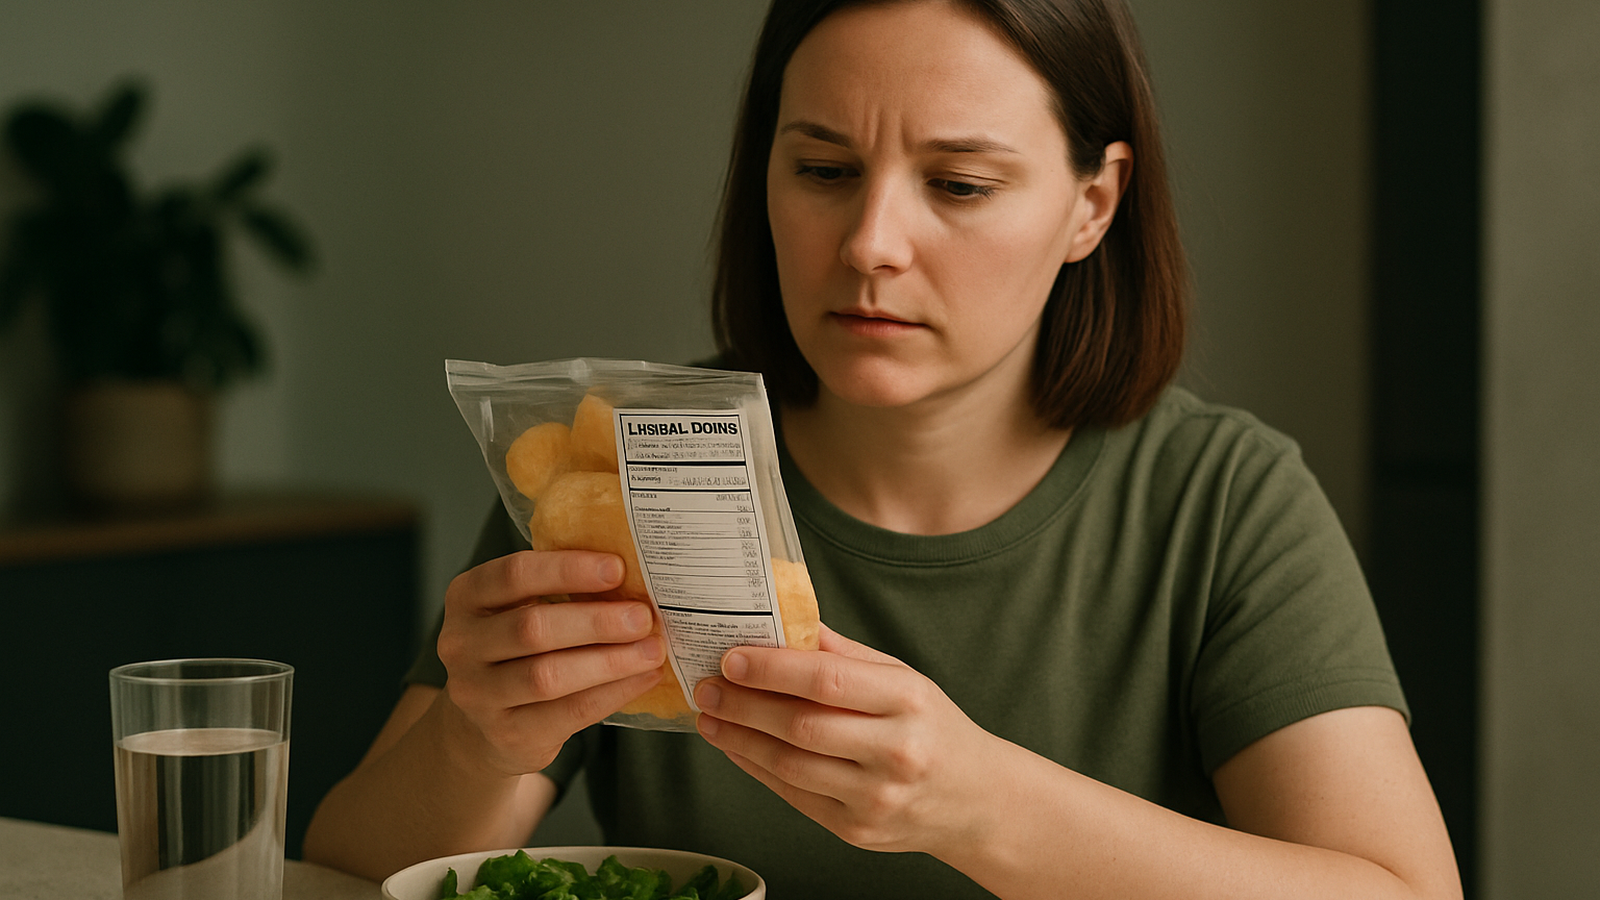
If you rely on a photo-based app, you can test its accuracy with a few simple comparisons. Pull out a packaged food with a nutrition label—a frozen meal, a protein bar, a serving of crackers. Take the app's photo, let it estimate, then compare the logged calories to the label. Repeat with a handful of meals over a few days.
Pay attention to patterns. Does the app consistently lowball mixed dishes, restaurant meals, or anything with sauce? Those are the foods most likely to hide calorie-dense ingredients the camera can't detect. Try logging the same meal manually—typing in each ingredient and portion—and see how the totals compare. The gap between photo estimate and manual entry can reveal whether your app is giving you a systematic discount.
User reviews and forums for your specific app may also surface accuracy complaints. If other people report that certain food categories always come in low, that's a signal worth heeding.
What this report does not establish
This coverage does not name which photo-based apps were tested, so you can't know if yours was included. It provides no average underestimation percentage, no range of error, no breakdown by food type. Manual-entry calorie trackers—where you type in foods and portions yourself—are not implicated in these reports.
There is no evidence that this is a new problem or a worsening trend. Photo-based tracking has always faced the technical limitations described above; whether app performance has changed over time is not addressed. The reports do not demonstrate that photo-based tracking causes weight gain or diet failure—only that underestimation could create a gap between logged and actual intake.
You cannot conclude from this coverage that all photo-based apps are inaccurate, or that AI nutrition tools as a category are unreliable. The available information describes a reported limitation in an unspecified set of apps, not a universal indictment.
If fuller study details emerge—what to look for
Should a complete study appear, evaluate it with these questions: Which apps were tested, and which versions? How many meals, and what variety—home-cooked, restaurant, packaged, mixed dishes? What was the average underestimation, and what was the range? Was the work peer-reviewed, and where was it published?
Also ask whether the findings apply to all food types or cluster around specific categories. An app that lowballs creamy pasta but nails plain grilled chicken has a different accuracy profile than one that undercounts across the board. Context matters. So does transparency about funding, conflicts of interest, and whether the researchers tested apps in real-world conditions or controlled lab settings.
Teaching yourself to ask these questions now means you'll be ready to interpret better evidence later—and you'll know when a headline has run ahead of the data.
---
Sources: Coverage from Deccan Herald, Medical Xpress, and Bioengineer.org.
Hidden calories photo apps often miss
Comparison basis: Typical restaurant or home-cooked portion
| Food or preparation | Hidden calorie source | Typical added energy | Why the camera can't see it |
|---|---|---|---|
| Roasted vegetables | Cooking oil | ~120 cal per tablespoon | Oil absorbed during roasting looks identical to plain vegetables |
| Restaurant pasta | Butter or cream in sauce | ~100–200 cal | Sauce appearance doesn't reveal fat content or cooking method |
| Coffee drink | Added sugar or syrup | ~50–150 cal | Clear or dissolved sweeteners leave no visual trace |
| Grilled chicken breast | Marinade or basting oil | ~50–100 cal | Surface glaze or absorbed fat doesn't change portion size |
| Mixed salad | Dressing already tossed in | ~100–200 cal | Dressing coats ingredients without pooling visibly |
| Baked potato | Butter, sour cream, cheese | ~150–300 cal | Melted toppings blend into potato surface |
| Stir-fry | Cooking oil | ~120–240 cal | Oil distributed throughout dish, not pooled or visible |
Added energy values are approximate and vary by recipe, brand, and portion. Photo-based apps estimate visible foods but cannot detect absorbed fats, dissolved sugars, or cooking methods.
Comments
No login needed. Keep it kind — abusive language is filtered.